Hayward, CA
Fresno, CA
Orange, CA
Sacramento, CA
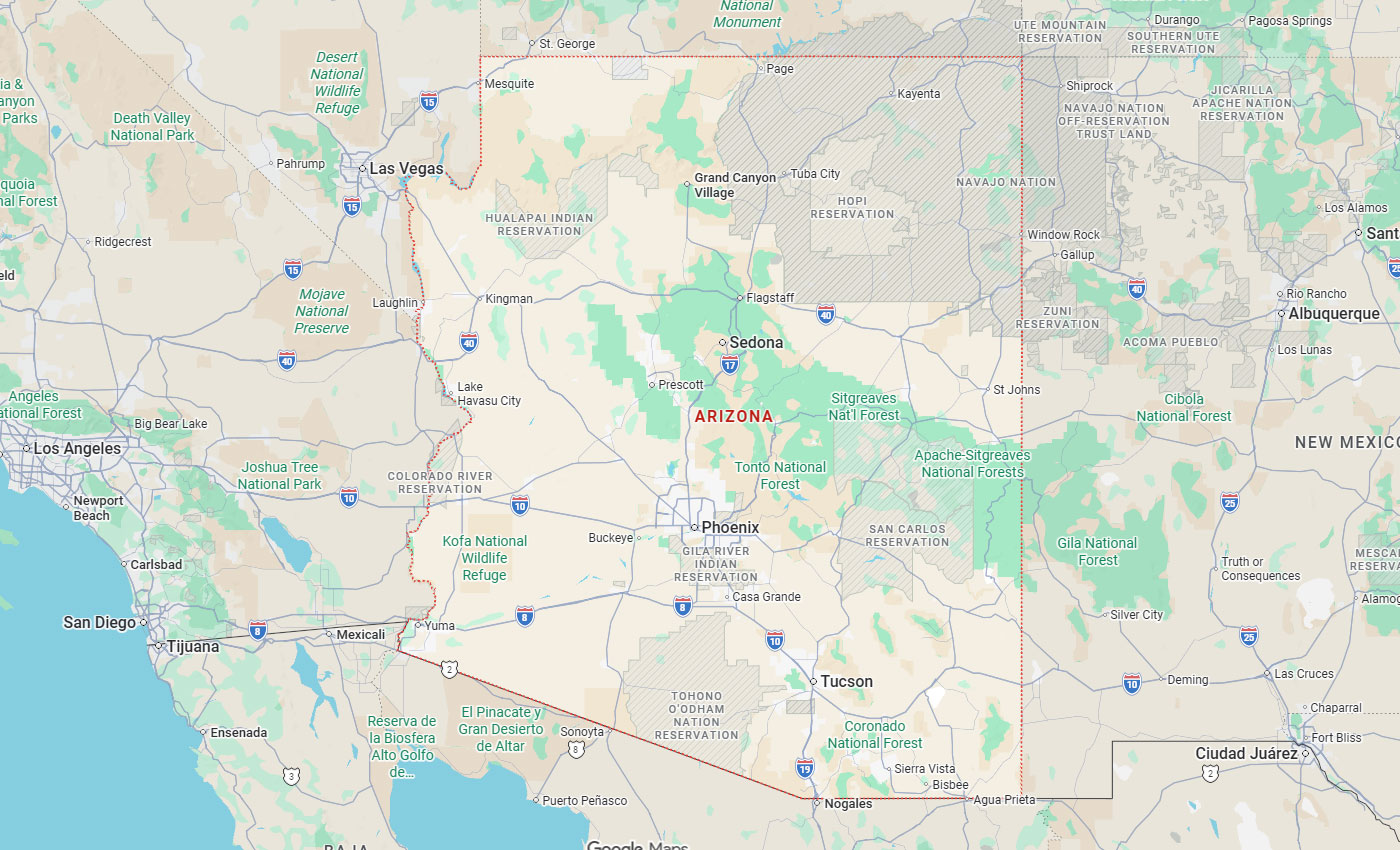
Phoenix, AZ
Key Takeaways
Subsurface utilities remain the largest source of construction risk. Traditional locating methods, manual geophysical surveys, aging records, and human interpretation cannot keep pace with the complexity of modern underground corridors. Artificial intelligence, drones, robotics, and smart mapping platforms are fundamentally changing how the industry detects, verifies, and manages buried infrastructure. These future technologies don't eliminate the need for human expertise. They amplify it, reducing interpretation time, improving consistency, and providing the quantifiable data quality that smart construction and modern design demand.
The question is no longer whether to adopt these technologies, but how quickly teams can deploy them while maintaining quality standards and defensible documentation.
Utility locating encompasses three primary activities: one-call marking (811 response for excavation notifications), designating (electromagnetic or GPR-based detection during surveys), and Subsurface Utility Engineering (SUE) (comprehensive mapping to ASCE 38-22 standards). The fundamental challenge is the "records vs. reality" gap. As-built drawings reflect design intent, not actual installation paths. Field changes, undocumented repairs, and historical infrastructure create a subsurface environment that rarely matches what's on paper.
Root causes of utility strikes include inaccurate records, process failures (communication breakdowns between one-call centers, locators, and excavation crews), site conditions (congested corridors, poor soil conditions, access restrictions), and human interpretation variability in manual data analysis.
The consequences are severe: worker injuries and public safety hazards, service outages requiring emergency repairs and regulatory fines for utility owners, individual strike costs ranging from $50,000 to $500,000 with cascading schedule delays and change orders, and erosion of public trust through service disruptions and traffic impacts.
Data quality determines design confidence and construction risk. The industry uses two primary frameworks: ASCE Quality Levels (QL-D through QL-A) in North America and PAS-128 survey categories in the UK and increasingly adopted globally.
| Quality Level | Typical Methods | Positional Reliability | Best-Fit Use Cases |
| QL-D | Record research only | Highly inaccurate | Preliminary planning only |
| QL-C | Surface feature surveying | Moderate; plan view only | Conceptual design |
| QL-B | GPR, EM locating | Horizontal: ±0.5–1.0 feet | Preliminary design, conflict screening |
| QL-A | Vacuum excavation + GPS/total station | Horizontal: ±0.1–0.5 feet; Vertical: ±0.2–1.0 feet | Final design, construction |
PAS-128 specifies detection scope, verification expectations (which utilities require physical exposure), and reporting requirements including method limitations, confidence statements, and undetectable utility disclaimers. AI, drones, and robotics must deliver outputs that resolve into these recognized quality classes with documented evidence trails and full auditability.
No single sensor detects all utilities. Comprehensive detection requires multiple technologies, each with specific strengths and failure modes, particularly challenging in adverse conditions like frozen soil environments.
Electromagnetic (EM) locating detects metallic utilities with connectivity, water mains, gas lines, power cables, and tracer wire. Failure modes include non-metallic utilities (PVC, HDPE), broken tracer wire, and shielded utilities. High soil conductivity, metallic clutter, and overhead power interference degrade signals. Validation requires correlation with records and GPR, with physical exposure at critical conflicts.
Ground Penetrating Radar (GPR) targets non-metallic utilities, voids, and disturbed soil. Blind spots include areas below metallic pipes and saturated or conductive soils. Hyperbolic reflections can represent utilities, rocks, or rebar, a persistent interpretive challenge. AI-powered CNNs reduce interpretation time by 40–70% in pilot programs by automating signal detection and classification.
Surface mapping context from LiDAR and photogrammetry provides terrain models and exposed utility positions, but cannot prove subsurface locations. Records and as-builts indicate design intent, materials, and installation dates, but frequently don't reflect field changes. Historical data on prior disturbances and installation sequences require physical verification.
AI utility locating transforms raw sensor data into actionable intelligence. Multi-sensor fusion platforms like Exodigo combine GPR, electromagnetic, and magnetometry data using AI to create comprehensive 3D subsurface maps, an "underground MRI" that no single sensor can produce alone.
What AI Changes: Automated signal picking detects hyperbolic reflections in radargrams without manual interpretation. Neural networks reduce clutter by distinguishing utilities from rocks, rebar, and soil variations. Analysis time drops by 40–70%, and analyst subjectivity disappears. Human decisions remain essential; verification triggers, ambiguous anomaly review, and final QA sign-off cannot be automated.
Confidence Output Framework provides transparency. High confidence (80–100%) indicates multiple sensors agree with strong signals, displayed as solid lines requiring normal excavation precautions. Medium confidence (50–79%) reflects single-sensor or weak signals, shown as dashed lines with "verify" notes and increased care, including potholing consideration. Low confidence (<50%) indicates indirect evidence only, displayed as dotted "unverified" lines requiring mandatory exposure before excavation.
AI Failure Modes Demand Guardrails: Training bias requires validation in each new environment with ground-truth potholes. Sensor miscalibration necessitates daily calibration with known targets and automated health checks. Over-trust is prevented by requiring human QA review of high-risk areas and flagging low-confidence zones. Model drift is addressed through continuous retraining and monitoring of false positive/negative rates.
Drone surveying provides rapid aerial reconnaissance and mapping without disrupting traffic or requiring ground crews in hazardous areas. They excel at site assessment, corridor mapping, and documentation, roles that complement, rather than replace, ground-based detection.
Drone-Enabled Improvements include access planning (aerial reconnaissance identifies deployment paths, traffic patterns, and constraints), hazard spotting (detecting overhead lines, obstacles, and environmental hazards before survey crews arrive), thermal imaging (detecting underground leaks via surface temperature anomalies), and time-stamped documentation for QA and dispute resolution.
Corridor Mapping Contributions leverage LiDAR and photogrammetry to generate high-accuracy digital terrain models and 3D site models. Platforms like Propeller Aero process drone data into accurate spatial contexts. Multi-temporal surveys enable change detection for new excavations and disturbances. Volumetric calculations provide cut/fill estimates and spatial context for depth assessments.
Drones Are a Poor Fit when environmental constraints exist (tree canopy blocks LiDAR, high winds ground aircraft, use ground-based LiDAR or postpone), regulatory restrictions apply (restricted airspace, BVLOS not permitted, use manned aircraft or elevated platforms), site geometry creates problems (urban canyons cause GPS errors, use terrestrial laser scanning), or subsurface data is required (UAV-GPR limited by <1m altitude requirement and signal penetration, use ground-based GPR carts or sleds).
Robotic mapping platforms eliminate human variability in sensor deployment, maintain consistent parameters across large survey areas, and operate in environments too hazardous or confined for personnel. Autonomy doesn't reduce the need for skilled operators; it shifts their role from equipment operation to mission planning and data validation.
Platform Types and Applications include autonomous GPR carts like ULC's AUSMOS that autonomously scan and map buried utilities using SLAM navigation in GPS-denied environments, pipe inspection crawlers such as RedZone Robotics' SOLO and IntegrityPRO that use deep learning to automatically classify defects to NASSCO standards, and robotic excavation systems like ULC's RRES that autonomously perform concrete cutting and vacuum excavation while reducing crew exposure to struck utilities and traffic.
Autonomy Benefits deliver repeatable paths with centimeter-level precision ensuring complete coverage without gaps, sensor health logging that flags degraded performance in real-time, consistent parameters maintaining optimal speed and spacing without human variability, and GPS-denied navigation using SLAM and IMUs for positioning in underground tunnels and urban canyons.
Reliability Demands a Strict Checklist: daily calibration (GPR time-zero, EM output, magnetometer baseline), pre-survey sensor functional tests, documented environmental tolerances (temperature, humidity, surface type compatibility), monthly recalibration with annual factory servicing, and clear stop-work triggers (sensor failure, positioning loss, unexpected hazards detected).
Smart mapping transforms ephemeral paint marks and field notes into georeferenced, version-controlled digital assets. The challenge is maintaining spatial precision from sensor data through final deliverables while documenting confidence, methods, and limitations at every step.
Distinguishing Data Types clarifies what each record type delivers. Utility records provide ±5–10 feet horizontal precision used by owners and planners, valid permanently but degrading over time. Paint and flags mark ±2 feet at the surface for excavation crews, valid only for days to weeks during the ticket duration. Mapped deliverables achieve QL-A precision (±0.1–0.5 feet horizontal) used by engineers and contractors, valid for months to years.
RTK/GNSS Failure Conditions require adaptive strategies: tree canopy or urban canyons demand switching to a total station from control points, absent base corrections require establishing a local base or using post-processed kinematic (PPK), multipath errors demand moving to open areas or applying mitigation algorithms. When RTK fails entirely, tie it to project control and reference State Plane or NAD83 coordinate systems.
System Integration flows field data into AutoCAD Civil 3D, Bentley OpenUtilities, and ESRI ArcGIS Pro via standardized APIs, ensuring interoperability across design and construction platforms.
A complete workflow integrates AI, robotics, and smart mapping while maintaining quality gates and human decision points. Technology accelerates data collection and processing; humans verify, interpret risk, and authorize critical decisions.
| Stage | Key Tools | Critical Outputs |
| Ticket/intake | One-call system | Locate request, assigned technician |
| Records review | GIS, as-builts | Desktop overlay, risk assessment |
| Field scan | EM, GPR, drone, robotics | Sensor data, GPS coordinates |
| Interpretation | AI radargram analysis, multi-sensor fusion | Utility positions, confidence scores |
| Verification decision | Risk matrix, specs | Go/no-go for potholing |
| Mapping | RTK GNSS, Civil 3D, ArcGIS | 3D utility model, confidence layers |
| QA | AI-assisted QC, peer review | QA certificate, exceptions log |
Verification Decision Triggers establish when physical exposure is required: high-consequence utilities (HV electric, high-pressure gas) mandate exposure regardless of sensor confidence, design-phase conflicts in high-congestion areas require exposure and upgrade to QL-A, ambiguous signals with medium risk escalate to engineering review with potholing consideration, and low-risk open sites with low uncertainty proceed with QL-B data and standard excavation caution.
Expected Deliverables include map layers with quality level and confidence attribution for each utility segment, metadata documenting methods, coordinate system, accuracy statements, and limitations, QA evidence (calibration logs, pothole photos, sensor health records), and change notes with version control tracking updates and verification events.
Technology adoption succeeds when it solves high-pain problems with measurable ROI. Start with projects where traditional methods consistently fail, technology can demonstrate clear improvement, and success metrics are quantifiable.
High-ROI First Use Cases include damage reduction using AI-GPR and robotics on high-risk corridors (50–90% strike reduction, one case achieved 97%), cycle-time reduction deploying drone LiDAR for highway corridors where AI cuts GPR analysis time 40–70%, and mapping quality improvements through multi-sensor fusion platforms like Exodigo (ROI ranges from $4.62 to $22.21 per dollar spent on SUE).
Pilot Checklist requires a bounded scope with measurable success criteria, ground-truth validation of 10–20% of detections, defined acceptance criteria (90% detection rate, <5% false positives), hands-on crew training with continuous feedback loops, and mandatory metadata logging from day one.
Track KPIs Relentlessly: damage rate targeting 50–90% reduction, cycle time targeting 40–70% reduction, design iteration savings of 30–60% typical for clash detection and coordination, and ROI of $4.62+ per dollar invested as validated by multiple studies.
Smart systems generate vast datasets. Without standardized structure, governance protocols, and security controls, data becomes a liability rather than an asset. Consistency enables aggregation, machine learning, and long-term asset management.
Minimum Dataset Per Locate must include sensor types and settings, georeferencing method (State Plane, NAD83, or local project coordinates), operator notes documenting field conditions and decisions, confidence outputs and uncertainty statements, QA artifacts (calibration logs, pothole photos), and deliverable versions with revision tracking.
Standardization Tactics deploy templates with required fields and validation rules preventing incomplete submissions, controlled vocabularies for utility classifications ensuring consistent terminology, interoperability formats (GeoJSON, KML, LandXML) enabling cross-platform exchange, and direct integration with Civil 3D, OpenUtilities, and ArcGIS Pro through standardized APIs.
Data Ownership Clarity Prevents Disputes: utility owners maintain the system of record with blockchain, enabling verification of crowdsourced data integrity, audit trails log all edits with version control, enabling rollback to prior states, and high-quality documented data reduces liability exposure, while poor undocumented data increases negligence risk.
Technology doesn't eliminate liability; it shifts the burden to documentation quality and adherence to established procedures. Courts increasingly expect objective evidence, not operator testimony alone.
Accountability Boundaries define responsibility across stakeholders: operators ensure proper calibration and accurate field notes, employers provide training, equipment maintenance, and SOP adherence, utility owners deliver accurate records and timely one-call responses, and vendors guarantee sensor accuracy within specifications and software warranties. Documentation proves due diligence when disputes arise.
Defensible Documentation requires calibration logs with daily sensor checks, QA checklists with supervisor sign-offs, confidence outputs and uncertainty statements for all detections, operator decision rationale (specifically why potholing was or wasn't performed), and exception notes with incident reports for anomalies and deviations.
"Know Before You Dig" Non-Negotiables remain unchanged regardless of technology: one-call compliance, adherence to response timelines and mark-out standards, verification triggers for high-risk scenarios, and proper training. NULCA and CGA are actively developing certification and training programs to address the skill gap as technology adoption accelerates.
The underground utility mapping market, valued at $1.62 billion in 2026, will reach $2.44 billion by 2032 at a 6.9% CAGR. Growth is driven by aging infrastructure replacement, regulatory pressure to reduce utility strikes, and technology maturation reducing deployment costs.
| Technology | 5-Year (2026–2031) | 10-Year (2031–2036) |
| AI/ML GPR | Widespread integration; AI-QC standard practice | Fully autonomous processing, minimal human oversight |
| Drone Mapping | UAV-GPR regulatory hurdles addressed; standardized workflows | Primary method for large-scale corridor mapping |
| Robotics | Autonomous crawlers standard for critical infrastructure | Robotic swarms, fully autonomous excavation mainstream |
| Digital Twins | AR/VR standard field crew tools; integrated city planning | Operational core for all smart city utility networks |
Task Evolution distinguishes what gets augmented versus automated. Complex interpretation, verification decisions, conflict resolution, and QA oversight remain human responsibilities, augmented by AI tools providing recommendations and flagging anomalies. Routine GPR processing, anomaly flagging, sensor path planning, and data formatting become fully automated, freeing skilled personnel for higher-value work.
Role Evolution creates new positions: data-enabled locators operate AI tools and interpret confidence scores, mapping QA leads validate automated outputs and maintain audit trails, and sensor ops techs handle robot maintenance, calibration, and troubleshooting. Workforce training and reskilling become critical as technology transforms traditional field roles into hybrid technical positions requiring both domain expertise and digital literacy.
These technologies are deployable today, but winning with them takes deliberate planning, tight pilots, and disciplined data practices before scaling. Teams that baseline performance, standardize data capture, and invest in training will realize ROI faster and reduce adoption risk.
Do first: Document workflows and define data-capture SOPs (what gets logged, where, and in what format). Start metadata logging and confidence scoring now, even with traditional methods, to build AI-ready infrastructure. Partner with NULCA/CGA for upskilling and certifications. Choose a bounded pilot with mandatory ground-truth validation, and confirm field data flows cleanly into Civil 3D, OpenUtilities, and ArcGIS Pro.
Next 90 days: Baseline KPIs (damage rate, cycle time, design iteration hours). Run vendor demos, shortlist 2–3 platforms that fit existing workflows, and establish data governance (ownership, audit trails, security). Secure pilot funding and form a cross-functional team (field, QA, IT, design).
Next 12 months: Execute the pilot and collect statistically meaningful results. Certify crews through hands-on training and phased responsibility. Deploy AI-assisted GPR (40–70% analysis time reduction) and drone corridor mapping (30–60% design coordination savings). Scale what works to drive 50–90% strike reduction and $4.62+ ROI per dollar invested.
The future rewards decisive action with rigorous quality control. Technology amplifies expertise; it doesn’t replace it. Teams that invest in both tools and training will lead the next decade of subsurface infrastructure management.
Ready to modernize your utility locating and mapping workflows? Contact Bess Utility Solutions to discuss how AI, drones, and smart mapping can reduce risk and improve project outcomes. Explore our full range of utility mapping services to see how we're implementing these future technologies today.