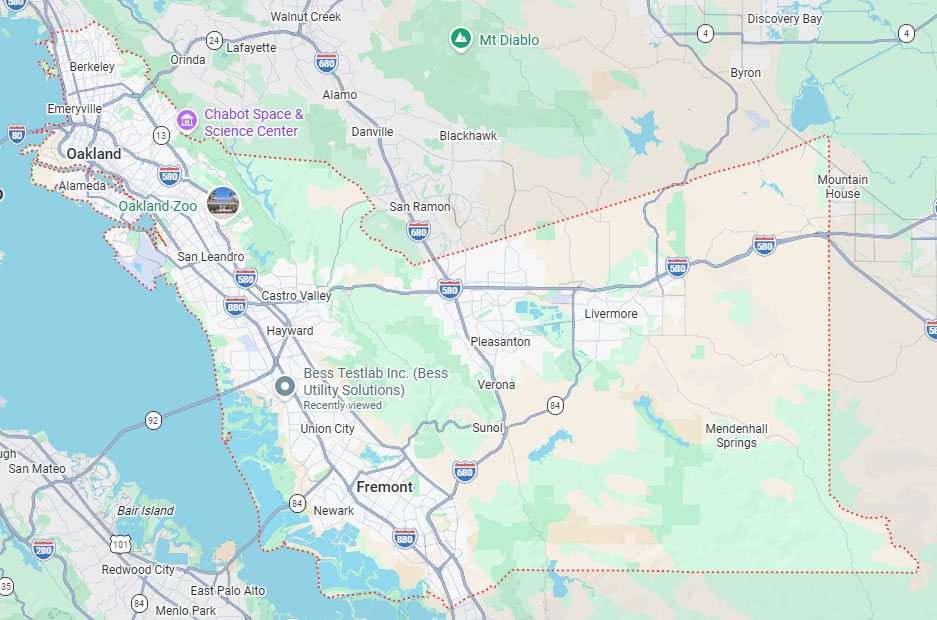
Hayward, CA
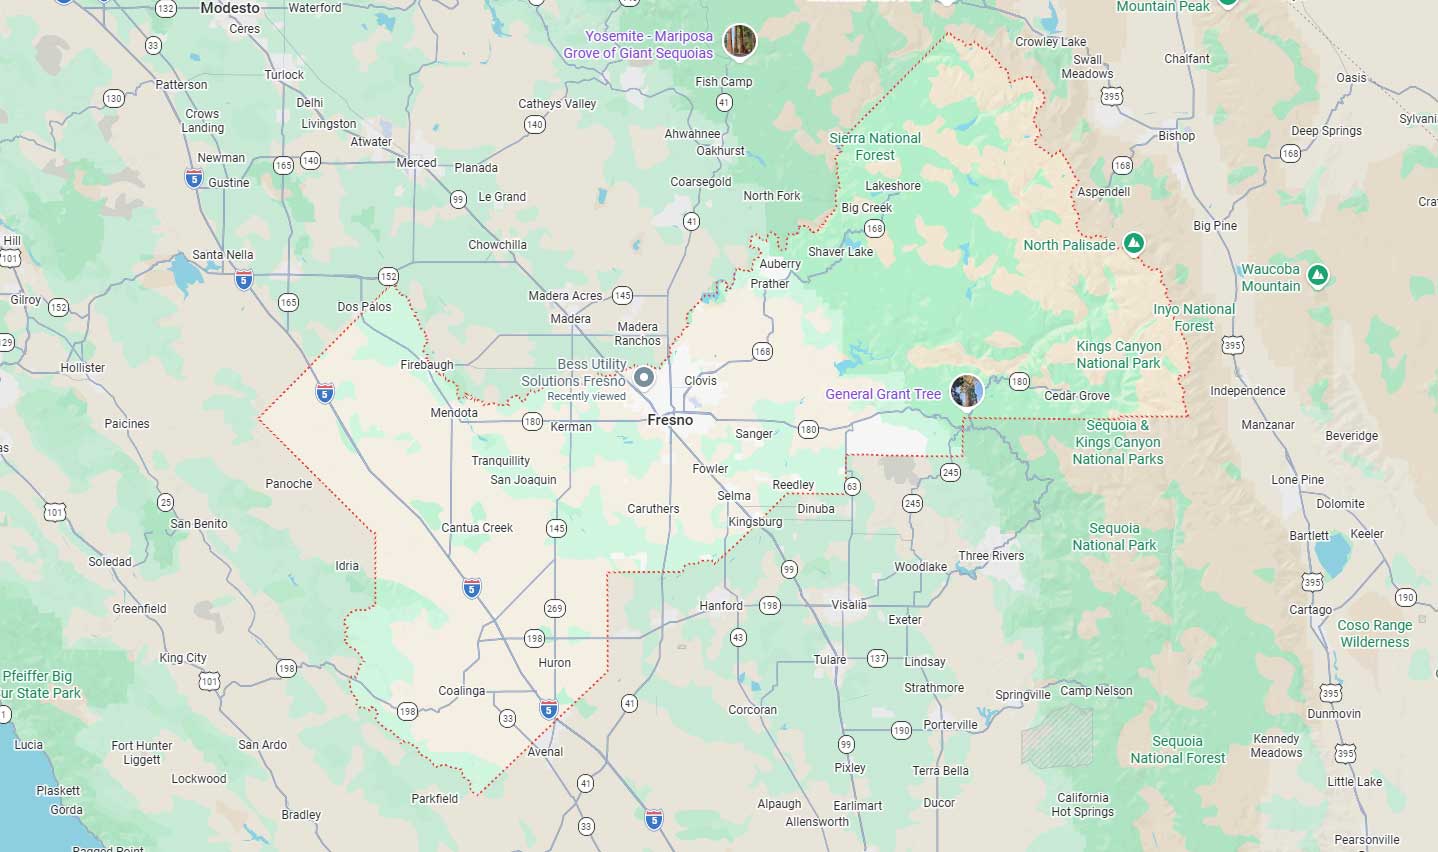
Fresno, CA
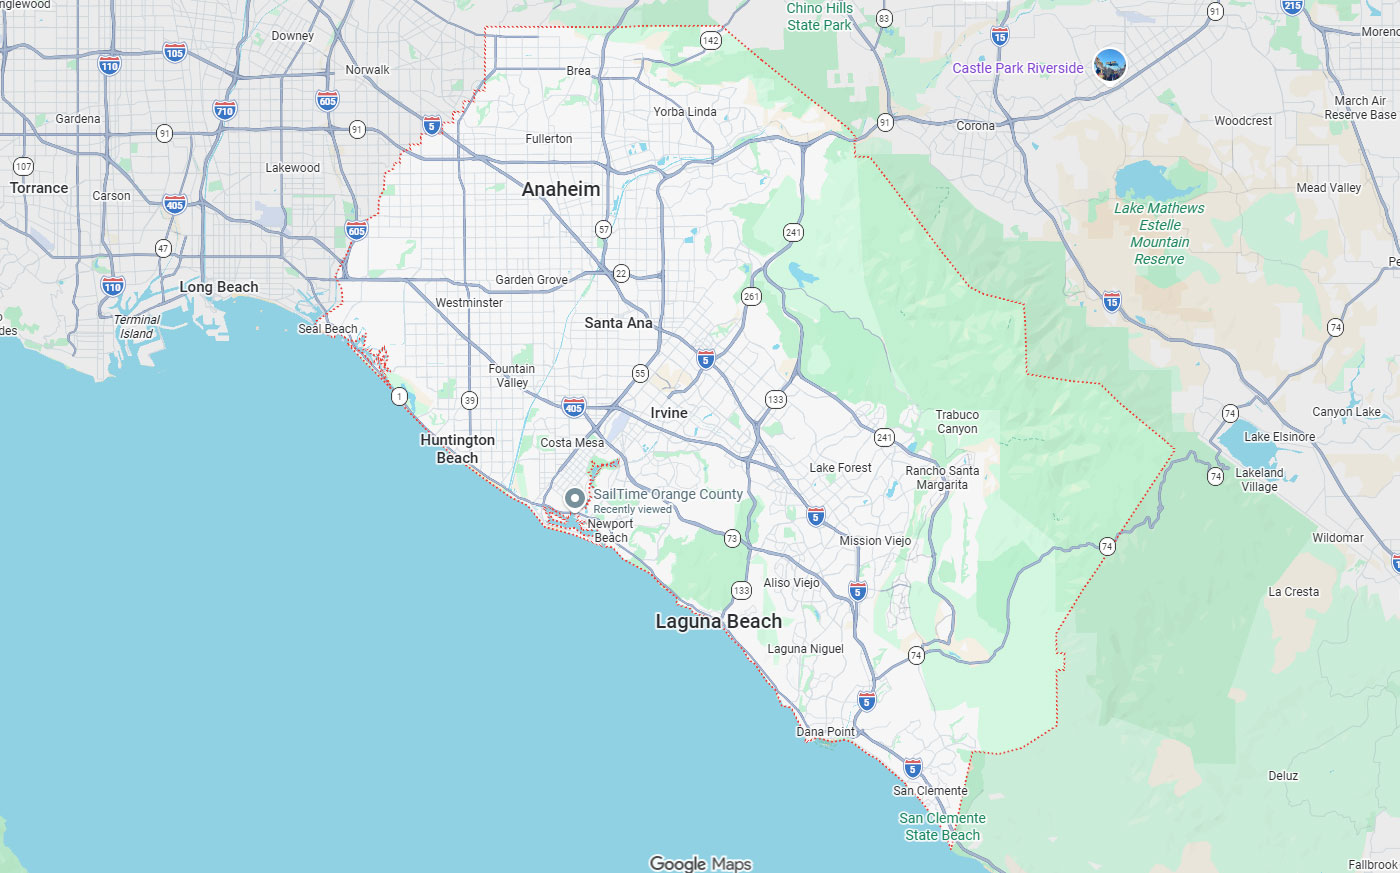
Orange, CA
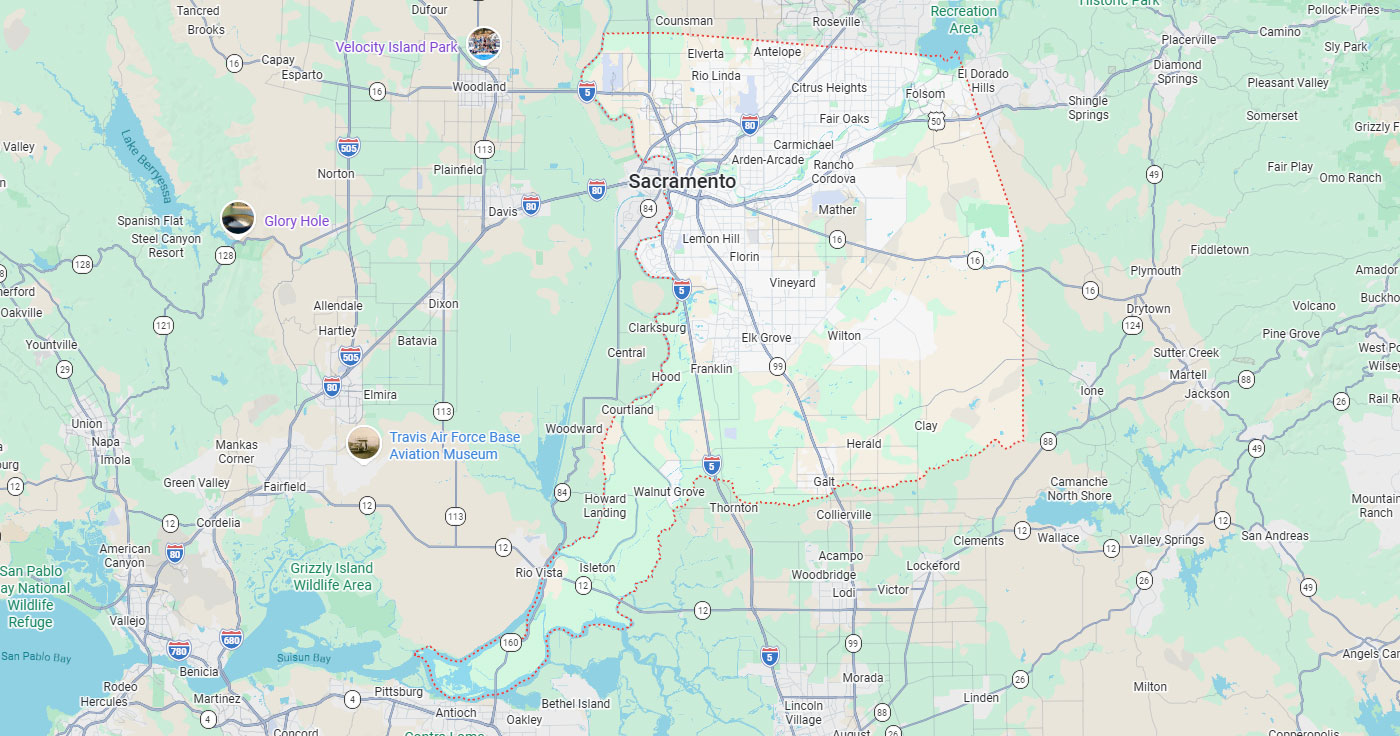
Sacramento, CA
Phoenix, AZ
Key Takeaways
Three-dimensional utility mapping transforms subsurface uncertainty into spatially accurate design intelligence. By creating verifiable digital models with precise horizontal and vertical coordinates, 3D utility mapping eliminates the guesswork that drives utility strikes, change orders, and schedule delays. The return is measurable: $4.62 to $22.21 saved for every dollar invested, with documented strike reductions of 50-97%.
This guide covers ASCE 38-22 quality frameworks, multi-technology workflows combining GPR and EM locating, BIM integration for automated conflict analysis, and phased implementation strategies that align data collection with design milestones, providing the practical roadmap to eliminate utility risk on your next project.
3D utility mapping creates spatially accurate digital models of subsurface infrastructure tied to common coordinate systems. Unlike 2D plans showing only plan view positions, 3D models capture horizontal and vertical locations, enabling direct integration with design software for automated clash detection and conflict analysis.
Define 3D utility mapping vs. 2D utility plans:
3D utility mapping creates a verifiable, three-dimensional digital model of subsurface infrastructure with horizontal and vertical coordinates tied to common coordinate systems (State Plane, NAD83). Unlike traditional 2D methods showing only plan view positions, 3D mapping provides spatially accurate models that integrate directly into design software for clash detection and conflict analysis.
Subsurface assets are typically represented:
Unknown utilities inject uncertainty at every project phase, forcing reactive workflows that escalate costs and timelines. Unreliable records create blind spots that manifest as field conflicts, emergency redesigns, and construction stoppages.
Common utility-related failure points:
Safety/outage dimension:
Utility strikes cost $50,000 to $500,000 per incident and escalate risk beyond direct repairs, causing service outages, life-threatening hazards (gas explosions, electrical shocks), emergency response scenarios, and regulatory penalties.
ASCE 38-22 establishes four Quality Levels (QL-A through QL-D) that define data confidence from record research to physical verification. These standards create a common language for specifying accuracy requirements and matching data collection methods to design-phase risk tolerance.
ASCE 38-22 Quality Levels:
| Quality Level | Method | Accuracy | Best Use |
| QL-D | Records research | Highly inaccurate | Preliminary planning only |
| QL-C | Surface feature survey | Moderate (plan view) | Conceptual design |
| QL-B | Geophysical (GPR, EM) | Horizontal: ±0.5-1.0 ft | Design with risk allowances |
| QL-A | Vacuum excavation + survey | Horizontal: ±0.1-0.5 ft; Vertical: ±0.2-1.0 ft | Final design, critical crossings |
Evidence-based outcomes:
No single detection method reliably locates all utility types. Effective subsurface data integration combines multiple technologies, geophysical detection for reconnaissance, selective excavation for verification, matched to soil conditions, utility materials, and accuracy requirements.
Comparing data sources:
| Source | Strengths | When Insufficient | Pair With |
| Records | Low cost; identifies owners/materials | Any spatial accuracy needs | Field detection (QL-B) or verification (QL-A) |
| GPR | Detects metallic/non-metallic utilities | Highly conductive soils; absolute certainty | EM + potholing for critical zones |
| EM Locating | Real-time metallic utility tracing | Non-metallic pipes; depth accuracy | GPR for complete picture |
| Potholing (QL-A) | Highest accuracy; visual confirmation | Large-area reconnaissance | Geophysical detection to target locations |
Method triggers:
When verification excavation is required:
QL-A potholing is required for critical crossings, tolerance-sensitive applications (pile driving, directional drilling), high conflict likelihood zones, and where strike consequences would be catastrophic (high-pressure gas, high-voltage electrical).
3D utility models eliminate spatial guesswork during design, enabling engineers to optimize alignments and foundations around verified infrastructure positions. This design optimization shifts conflict resolution from the field, where fixes are expensive and disruptive, to the design phase, where adjustments are low-cost digital edits.
Design decisions improved:
Structural/foundation benefits:
BIM coordination value:
Integrating 3D utility data with BIM enables clash detection to automatically identify spatial conflicts during design, before construction. This catches conflicts early for resolution through alignment adjustments or planned relocations, eliminating coordination surprises that drive costly change orders.
Accurate 3D utility data eliminates the field uncertainty that generates change orders and schedule delays. Contractors bid with confidence, excavate with precision, and avoid the emergency responses that cascade into project-wide disruptions, delivering measurable risk reduction across all construction phases.
Construction impacts reduced:
Strike reduction:
The documented 50-90% reduction in strikes results from: better locate/mark accuracy, improved excavation planning with known positions, better sequencing minimizing exposure in high-risk zones, and better protective measures.
Bid/constructability improvements:
Effective utility mapping aligns data collection milestones with design phases, targeting investigation intensity to design maturity. Early reconnaissance (QL-B) establishes the base model; selective verification (QL-A) confirms critical zones as design progresses, supporting comprehensive construction planning.
Critical scoping inputs:
| Scope Item | Recommended Default | Risk If Omitted |
| Area of Interest | Project limits + 25-ft buffer | Utilities just outside cause conflicts |
| Target Quality Level | QL-B general; QL-A critical zones | Insufficient accuracy = design errors |
| Deliverable Format | CAD + attributed GIS; IFC for BIM | Format incompatibility delays integration |
Milestone-aligned execution:
Survey control essentials:
Utility models must tie to the same State Plane, NAD83, or local coordinate system as design files, with explicit vertical datum definition. Without disciplined coordinate management, even accurate data becomes unusable due to misalignment.
Deliverable packaging by audience:
| Audience | Format | Required Content |
| Designer | DWG/DGN | Centerlines, materials, depths, QL tags |
| BIM Coordinator | IFC or Revit | 3D geometry, clash detection-ready |
| Contractor | PDF plans + CAD reference | Locations, conflicts, protection requirements |
QA/QC essentials:
Design-ready utility data requires more than accurate geometry; it demands standardized formats, complete attribution, and governance protocols that prevent model degradation during multi-discipline coordination. Without these controls, data quality erodes through untracked edits and format conversions.
File formats:
| Format | Best For | Handoff Tips |
| DWG/DGN | Design integration, plan sheets | Provide layer key and coordinate metadata |
| IFC | BIM coordination, clash detection | Validate schema version compatibility |
| GIS | Asset management, web mapping | Include projection files; use geodatabase for complex attributes |
Required attributes per utility:
| Attribute | Why It Matters | Who Provides |
| Material | Excavation methods, protection needs | Field detection or QL-A verification |
| Diameter | Clearance calculations | Records or QL-A verification |
| Depth/Invert | Vertical conflict analysis | QL-B (estimated) or QL-A (surveyed) |
| Quality Level | Indicates confidence and design use | SUE provider |
Governance essentials:
Target investigation intensity to project complexity and consequence of failure. High-density urban sites with deep excavations justify comprehensive QL-A verification; low-risk greenfield projects may require only QL-B reconnaissance. The key is matching data confidence to design risk tolerance.
High-ROI project types:
Phased approach:
ROI framing:
Studies show $4.62 savings for every $1 spent on SUE, with mapping typically representing only 0.5-1.65% of the project budget. The utility mapping investment is justified by avoiding even a single $50,000-$500,000 utility strike or design iteration.
Effective procurement specifications separate qualified providers from those delivering aesthetically pleasing but unverified models. Focus on methodology transparency, staff credentials, and contractual commitments to accuracy and traceability, not just deliverable appearance.
Vendor qualification questions:
Critical contract clauses:
| Topic | What "Good" Looks Like | Red Flags |
| Confidence/Limitations | Explicit QL designations; accuracy tolerances per feature | Vague "industry-standard accuracy"; no QL tags |
| Reliance | Clear statement data suitable for design at stated QL | Disclaimers like "for reference only" |
| Acceptance Criteria | Quantitative checks (coordinate alignment, QL coverage %) | Subjective criteria; no measurable standards |
Utility models fail when they don't integrate into design workflows or when users lose confidence in the data. The most common breakdowns stem from coordinate misalignment, missing confidence indicators, and governance gaps that create competing model versions.
Why models don't get used:
Models fail when they don't integrate into workflows due to format mismatch, overcomplexity, lack of trust (missing confidence indicators), coordinate misalignment, or no governance (multiple versions with no "official" model).
Misalignment causes and fixes:
"False precision" risks:
Stakeholders consistently question whether 3D mapping eliminates verification needs, how costs scale with project scope, and who maintains data accuracy through design changes. Clear answers, from utility mapping services, on these fundamentals build approval consensus and set realistic expectations.
Replacement vs. complement:
3D mapping doesn't eliminate verification, it reduces and focuses it. Geophysical detection (QL-B) provides comprehensive coverage, allowing strategic QL-A verification at the 10-20% of utilities where physical confirmation is truly required.
Cost drivers and controls:
| Driver | How to Control It | Tradeoff |
| Verification Level | QL-A only at conflicts/critical zones | Unverified utilities carry higher design risk |
| Deliverable Complexity | Standardize formats; limit customization | May require more designer post-processing |
| Schedule Constraints | Align with design milestones; allow contingency | Compressed schedules sacrifice thoroughness |
Ownership/maintenance:
Start with a focused pilot that proves ROI on a manageable scale before scaling to enterprise-wide adoption. Target a high-risk project segment where utility conflicts are probable and consequences are measurable, this builds internal buy-in through documented cost avoidance.
Practical pilot plan:
Choose a high-risk hotspot, define QL-B for detection plus QL-A at 3-5 conflict points, integrate the utility model into the design, and measure avoided clashes.
Internal review gates:
SOP components:
Ready to eliminate utility risk on your next project? Contact Bess Utility Solutions to discuss how our comprehensive utility mapping services can protect your schedule and budget.